Introduction
In this article, you will learn about a tool that allows you to track resource usage statistics for your hosting accounts.
Users will notice that we have maximized the information available to the customer. The fact that the data is displayed in real time makes the proposed solution particularly beneficial to our clients. Furthermore, if this kind of information allows you to notice that you are using a lot of resources, an increase in your plan for more performance is suggested.
Prerequisite
Go to https://mg.n0c.com/en/.
Definition of ressources
The following is a description of each of the resources for which statistics on their use are available:
| Ressource | Definition |
| IO | The exchange of information between the processor and its associated peripherals is called input/output (IO). |
| CPU | Number of cores of the microprocessor solicited at a given time. |
| Mémoire virtuelle | Mechanism based on the use of a mass memory to help the physical memory. |
| Mémoire physique (RAM) | The physical memory (also called random access memory, or RAM), is the memory in which a computer places data during processing. Its contents can be modified during normal use; it is usually erased as soon as the computer is turned off. |
Available Statistics
Since your resource pool offered under the plan you paid for determines the calculation of the number of hosting accounts, it is important to know the usage of your resources. This way, you know if you are distributing your resources well from one account to another.
The statistics represented on the four graphs that we describe in detail in the paragraph Description of Statistics are extremely useful. Here is how to access and display the data in N0C:
- Click on Statistics -> Performance :

- Choose the period of time you are interested in for the display of the resources used.
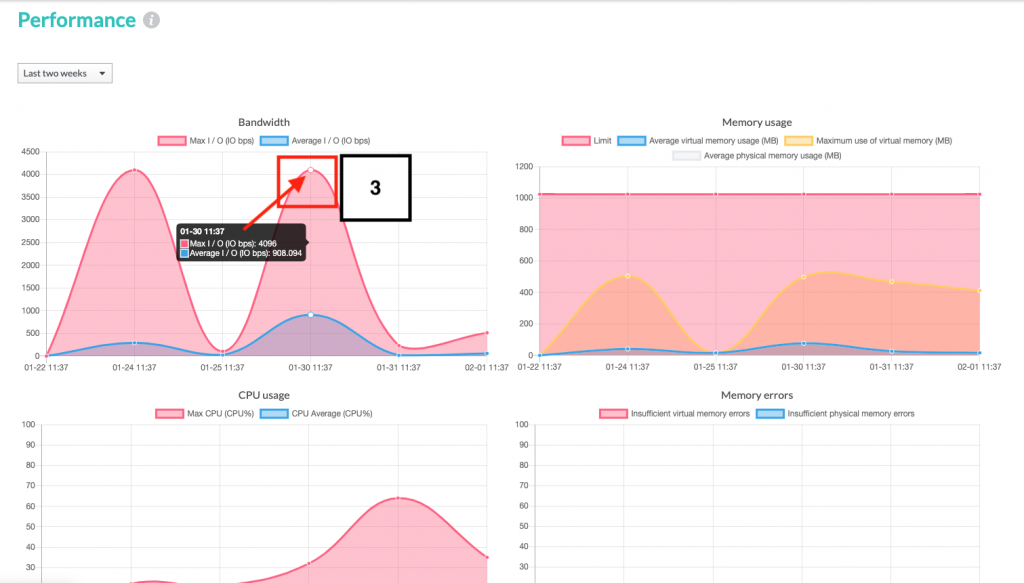
- Hover your cursor over the points on the graph corresponding to the points in time for which data are to be displayed:
Description of Statistics
The following describes the data displayed on the statistical graphs. In all four cases, the x-axis (horizontal) corresponds to the point in time when the quantity displayed on the y-axis (vertical) is measured.
| Data | Descriptions |
| Bandwidth | The maximum and average number of IO operations in bits per second (bps) at the time of execution of a combination of read and write tests at a given time. |
| Memory usage | This data is displayed in MB: -Limit memory usage (virtual and physical). -Average virtual memory usage. -Maximum virtual memory usage. -Average physical memory usage. |
| CPU usage | Percentage of maximum (Max UCT in CPU %) and average (Average UCT in CPU %) microprocessor cores requested at a given time. See Note below. |
| Memory errors | Number of insufficient virtual memory errors and number of insufficient physical memory errors. The statistics provide, at a given time, the number of insufficient virtual memory errors; they also provide, in MB and at a given time, the average and maximum usage. |